


Line Graph – Data Interpretation for CAT
[latexpage]
As the name suggests, data interpretation is all about logical interpretation of the given data and answering questions. Data interpretation carries the same weightage in third section of CAT as reading comprehension in verbal section or geometry and algebra in quant section. For the past two years (CAT 2014 & CAT 2015), CAT carries approximately 20 questions on data interpretation. If you haven’t been serious about this topic till now, there is never a better day than today to start!
Data can be represented in many ways, some of the most common ways are tables, bar graphs, Line Graphs, paragraphs, pie charts etc… This article will focus on LINE GRAPHS and will introduce you with the most basic aspects of a line graph.
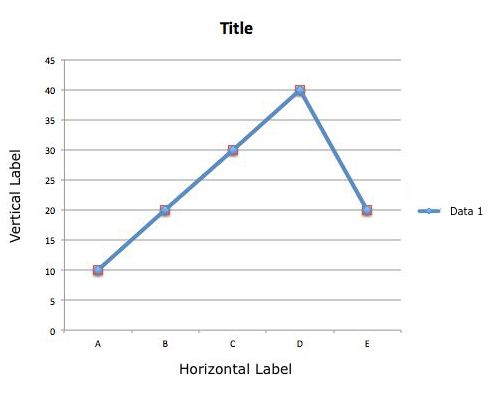
above is one of the basic example of a line graph and its various component are as follows:
Title : The title of the graph tells us what the graph is about
Label : Horizontal and vertical labels tell us about type of the data
Axis : X and Y axises tell us about the unit of the data.
Dots : Dots on the line graph tell us combination of X and Y axis data.
Line : The blue line connecting the dots in the above graph gives a visual representation of the data, and its variation.
Look at the graph below and check its different component.

Title : The graph is about “No of students at TathaGat centre”.
Label : Horizontal label represents “Time” and vertical label represents “No of students” .
Axis : X axis represents time in hours and Y axis represents absolute number.
Dots : Dots represents the number of boys at a particular time at TathaGat centre. i.e. there were 50 boys at 12:00’o clock at TathaGat centre.
Line : That blue line is showing how the number of students first increases from 12:00 to 13:00’o clock and then decreases to 40 at 14:00’o clock and then kept increasing till 16:00’o clock.
From the above visual representation we can easily say that when line goes up the number of students increases and when it goes down the number of student decreases. But at the same time the above blue line can also tells us the rate of this increment or decrement or in other words growth (positive or negative) of the given data.
Rate of the increment or decrement is directly related with the slope of the line. Slope is nothing but the steepness or the inclination of the line. Growth is directly proportional to the steepness of the line that is Steeper line represents higher growth. So far we have seen line graph with single variable or single data, below is the example of a line graph with two variable.
Observe the graph and its different component carefully and answer the question:
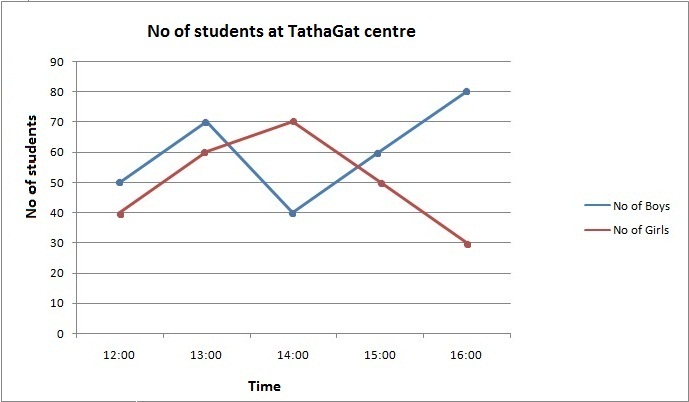
Q1. At what time the number of boys were highest at the centre?
Q2. At what time the total number of students were lowest at the centre?
Q3. During what period the rate of growth of the numbers of girls were highest?
Solution 1: After observing the graph one can easily say that the number of boys were maximum at 16:00 o’clock.
Solution 2: To find the solution of this question we need to add number of boys and girls at different hours.
At 12:00 o’clock total number of students = 90
At 13:00 o’clock total number of students = 130
At 14:00 o’clock total number of students = 110
At 15:00 o’clock total number of students = 110
At 16:00 o’clock total number of students = 110
so the answer is at 13:00 o’clock number of students were highest
Solution 3: After observing the graph we can say that the red line is the steepest between 12:00 – 13:00 , hence during 12:00 – 13:00 the rate of growth of number of girls were highest.
We can check it by the using calculation :
the growth rate between 12:00 – 13:00, 13:00 – 14:00, 14:00 – 15:00, 15:00 – 1600 is respectively 50%, 16.66%, – 28.56% and -40%
Lets try some more questions:
Set 1:
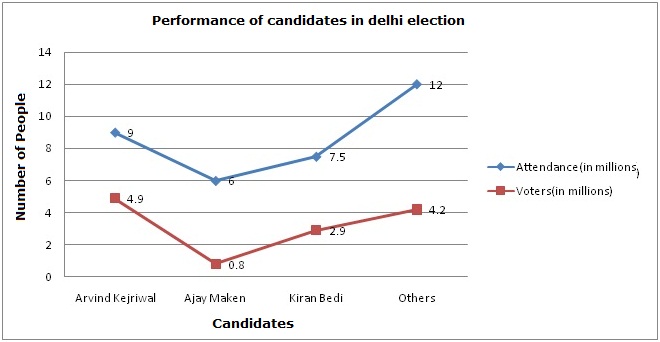
In the below given Line graph one of the line shows the number of people who attended the rallies of different candidates in Delhi Assembly election 2015 and other line shows the number of people who actually voted for them. Assume that only whoever was present during the rally, voted for one of these candidates.
Q1. What is the ratio of number of people who were not present during Kejriwal’s rally and number of people who did not vote for him?
1. $\frac{33}{83}$ 2. $\frac{38}{79}$ 3. $\frac{41}{91}$ 4. $\frac{7}{17}$
Q2. Which of these candidate received maximum percentage of vote with respect to the number of people attended their rallies?
1. Arvind Kejriwal
2. Ajay Maken
3.Kiran Bedi
4.Others
Q3. Percentage of people who were present in the Kiran Bedi’s rally but did not vote for her is equal to
1. 38.67 %
2. 61.33 %
3. 27.27 %
4. Cannot be determined
Q4. Minimum what percent of voters who voted for Others should have voted for Kiran bedi to make her win the election?
1. 44.44%
2. 42.85%
3. 47.61%
4. 49.49%
Solution 1: number of people who were present in the rallies = number of people who voted = 4.9 + 0.8 + 2.9+ 4.2 = 12.8 m
So, total number of people who were not present / total number of people who did vote
= $\frac{12.8 – 9}{12.8 – 4.9} = \frac{3.8}{7.9} = \frac{38}{79}$
Solution 2: percentage votes received by the candidates with respect to the number of people attended their rallies,
Arvind Kejriwal, $\frac{4.9 \times 100}{9} = \frac{490}{9}\%$
Ajay Maken, $\frac{0.8 \times 100}{6} = \frac{40}{3}\%$
Kiran bedi, $\frac{2.9 \times 100}{7.5} = \frac{116}{3}\%$
Others, $\frac{4.2 \times 100}{12} = 35\%$
By comparing these values, Kejriwal got maximum % of votes with respect to the number of people who attended his rally.
Solution 3: The number of people who voted for Kiran Bedi can also be other than who were present at her rally.
Hence answer is cannot be determined.
Solution 4: Votes difference between Arvind Kejriwal and Kiran Bedi = 4.9 – 2.9 = 2 m
Required % = $\frac{2 \times 100}{4.2} = 47.61\%$
Set 2:
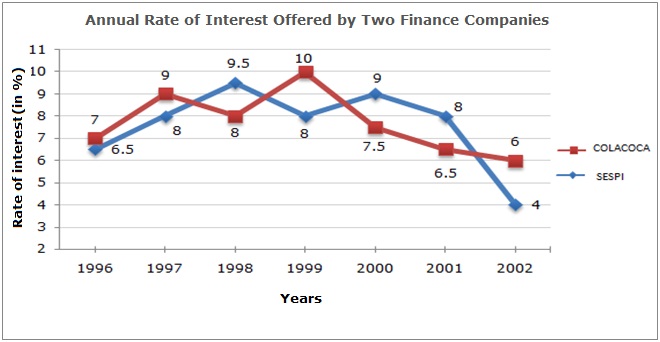
“COLACOCA” and “SESPI” are two different finance companies and they declare fixed annual rate of interest on the amounts invested with them by investors. The annual rate of interest offered by the two Companies over the years are shown by the line graph below.
Q1. In year 2000, a part of Rs. 60 lakhs was invested in “COLACOCA” and the rest was invested in “SESPI” for one year. The total interest received was Rs. 4.86 lakhs. What was the amount invested in “COLACOCA”?
1. 18
2. 36
3. 24
4. 40
Q2. An investor invested a sum of Rs. 12 lakhs in “COLACOCA” in 1998. The total amount received after one year was re-invested in the same Company for one more year. The total appreciation received by the investor on his investment was?
1. 2,96,200
2. 2,42,200
3. 2,25,600
4. 2,16,000
Q3. An investor invested Rs. 5 lakhs in “SESPI” in 1996. After one year, the entire amount along with the interest was transferred as investment to “COLACOCA” in 1997 for one year. What amount will be received from “COLACOCA”, by the investor?
1. 5,94,550
2. 5,80,425
3. 5,77,800
4. 5,77,500
Q4. A sum of Rs. 4.75 lakhs was invested in “SESPI” in 1999 for one year. How much more interest would have been earned if the sum was invested in “COLACOCA”?
1. 19000
2. 14250
3. 11750
4. 9500
Solution 1: let ‘x’ be the amount invested in “COLACOCA” and 60 – x in “SESPI”.
So 7.5% of x + 9% of (60 – x) = 4.86
X = 36.
Solution 2: Amount received from “COLACOCA” after one year (i.e., in 199) on investing Rs. 12 lakhs in it
= Rs. [12 + (8% of 12)] lakhs
= Rs. 12.96 lakhs.
Amount received from “COLACOCA” after one year on investing Rs. 12.96 lakhs in the year 1999
= Rs. [12.96 + (10% of 12.96)] lakhs
= Rs. 14.256.
Appreciation received on investment during the period of two years
= Rs. (14.256 – 12) lakhs
= Rs. 2.256 lakhs
= Rs. 2,25,600.
Solution 3: Amount received from “SESPI” after one year on investment of Rs. 5 lakhs in the year 1996
= Rs. [5 + (6.5% of 5)] lakhs
= Rs. 5.325 lakhs.
Amount received from “COLACOCA” after one year on investment of Rs. 5.325 lakhs in the year 1997
= Rs. [5.325 + (9% of 5.325)] lakhs
= Rs. 5.80425 lakhs
= Rs. 5,80,425.
Solution 4:
| Difference | = Rs. [(10% of 4.75) – (8% of 4.75)] lakhs |
| = Rs. (2% of 4.75) lakhs | |
| = Rs. 0.095 lakhs | |
| = Rs. 9500. |

0 comments